
According to insights from Future Data Stats, The Global Augmented Reality Tourism Market was valued at USD 7.02 billion in 2025. It is expected to grow from USD 8.97 billion in 2026 to USD 50.23 billion by 2033, registering a CAGR of 27.9% during the forecast period (2026–2033).
MARKET OVERVIEW:
The augmented reality tourism Market exists to transform travel from passive sightseeing into immersive participation. It overlays digital storytelling, historical reconstruction, navigation, and interactive content onto real-world destinations through smartphones, tablets, and wearable devices. This gives travelers richer context in real time while helping tourism brands create memorable experiences that stand apart in a crowded market. Hotels, tour operators, museums, and destination marketers use augmented reality to increase visitor engagement, drive premium service adoption, and turn every landmark into a branded touchpoint that converts curiosity into spending.
“Augmented reality tourism turns sightseeing interactive, helping destinations increase engagement extend visits, and build traveler loyalty worldwide.”
The market also serves a strong commercial purpose by helping tourism businesses increase bookings, extend visitor dwell time, and generate repeat visits through digital engagement. Augmented reality adds measurable value before, during, and after the trip by making travel more personalized, interactive, and shareable. Businesses use it to showcase attractions with visual previews, gamified exploration, and multilingual storytelling that improve satisfaction and inspire stronger spending. As travelers seek experiences over transactions, augmented reality gives tourism brands a powerful sales engine built for conversion, differentiation, and long-term loyalty.
MARKET DYNAMICS:
The Augmented Reality Tourism Market grows through location-based storytelling, smart glasses, and AI-guided heritage overlays. “Augmented reality tourism turns sightseeing interactive, helping destinations increase engagement extend visits, and build traveler loyalty worldwide.” Businesses monetize richer visitor journeys, attract travelers, and create partnerships across hospitality, museums, and destination marketing, giving brands a scalable path to stronger bookings and faster revenue growth.
Rising adoption and demand for travel drive the Augmented Reality Tourism Market, while development costs and uneven infrastructure restrain expansion. “Augmented reality tourism turns sightseeing interactive, helping destinations increase engagement extend visits, and build traveler loyalty worldwide.” Opportunities grow through apps, museum collaborations, content, and branded experiences that help companies convert visitor interest into bookings, repeat visits, and measurable growth.
Analyst Key Takeaways:
The Augmented Reality Tourism Market is gaining momentum as destinations, museums, hotels, and travel operators increasingly adopt immersive digital experiences to enhance visitor engagement. AR-powered navigation, interactive cultural storytelling, virtual destination previews, and multilingual content are transforming how travelers explore attractions while improving accessibility and personalization. Growing smartphone penetration, widespread 5g deployment, and advances in spatial computing are further accelerating market adoption across both leisure and business travel.
The market is also benefiting from rising investments in smart tourism initiatives and digital destination management, enabling tourism providers to deliver real-time, location-based experiences. Integration of artificial intelligence, cloud platforms, and geospatial technologies is expanding the capabilities of AR applications, while collaborations between technology developers, travel agencies, and hospitality companies continue to drive innovation. As experiential tourism becomes a key competitive differentiator, demand for scalable and interactive AR solutions is expected to strengthen throughout the forecast period.
AUGMENTED REALITY TOURISM MARKET SEGMENTATION ANALYSIS
BY COMPONENT:
The software segment holds a leading position within the augmented reality tourism market as tourism operators increasingly prioritize immersive digital experiences over traditional visitor engagement methods. Modern AR applications enable travelers to access contextual information, interactive storytelling, multilingual guidance, and real-time destination insights directly through mobile devices. As tourism organizations seek scalable solutions that enhance visitor satisfaction while reducing operational complexity, software platforms continue to attract significant investments. Their flexibility, ease of updates, and compatibility with existing tourism ecosystems make them a preferred choice for destinations aiming to deliver memorable digital experiences.
“Research Insight: Software-driven AR tourism solutions are accelerating visitor engagement by transforming passive sightseeing into interactive destination experiences globally.”
Hardware remains a critical growth contributor, supported by continuous advancements in smart glasses, wearable displays, and mobile device capabilities. Tourism providers are increasingly exploring hardware-enhanced experiences that allow visitors to engage with historical reconstructions, virtual guides, and location-based content in a highly visual format. Meanwhile, service providers are gaining traction by offering implementation, maintenance, customization, and content development expertise. As destinations compete to attract digitally connected travelers, demand for integrated hardware, software, and professional service offerings is expected to strengthen, creating substantial commercial opportunities across the market ecosystem.
BY DEVICE TYPE:
Smartphones and tablets dominate the device landscape due to their widespread availability, affordability, and familiarity among travelers worldwide. Most tourists already carry mobile devices capable of supporting sophisticated AR applications, eliminating the need for additional equipment. Tourism organizations favor mobile-first AR deployments because they offer rapid scalability and lower adoption barriers. Enhanced camera technology, faster processors, and improved connectivity have significantly increased the effectiveness of smartphone-based AR experiences. This accessibility allows destinations to reach broader visitor audiences while maintaining cost-efficient deployment strategies that support sustained market expansion.
“Research Insight: Mobile-based AR experiences continue to outperform alternative platforms due to convenience, accessibility, and strong user adoption rates.”
AR smart glasses and headsets represent an emerging growth area driven by demand for more immersive and hands-free tourism experiences. These devices enable visitors to interact with digital content while maintaining full awareness of their physical surroundings, creating a seamless exploration environment. Although adoption remains comparatively limited due to higher costs, ongoing technological improvements are enhancing usability and comfort. Other wearable devices are also contributing to market development as tourism providers experiment with innovative engagement formats. As hardware prices gradually decline, advanced wearable technologies are expected to gain stronger commercial acceptance.
BY APPLICATION:
Destination exploration represents the dominant application segment as travelers increasingly seek enriched experiences that go beyond traditional sightseeing. AR technologies allow destinations to present layered digital content, historical narratives, cultural information, and interactive visualizations directly within real-world environments. Tourism boards and attraction operators are leveraging these capabilities to create differentiated visitor experiences that encourage longer stays and greater engagement. The ability to transform ordinary landmarks into dynamic storytelling platforms significantly enhances visitor satisfaction, making destination exploration one of the most commercially valuable applications within the augmented reality tourism ecosystem.
“Research Insight: Interactive destination exploration remains the primary revenue-driving application as travelers increasingly value personalized experiences.”
Cultural and heritage tourism, museums, exhibitions, navigation, and theme park experiences are also experiencing notable growth. Historical sites benefit from AR-powered reconstructions that bring past events and structures to life, creating deeper emotional connections for visitors. Museums utilize interactive exhibits that encourage active participation rather than passive observation. Navigation and wayfinding applications improve convenience by helping travelers efficiently discover attractions and services. Theme parks continue integrating AR features to increase engagement and visitor spending. Together, these applications demonstrate the broad commercial versatility of augmented reality across diverse tourism environments.
BY END USER:
Individual travelers account for the largest share of demand as consumers increasingly embrace technology-enhanced travel experiences. Modern tourists expect personalized content, instant information access, and engaging digital interactions throughout their journeys. AR applications satisfy these expectations by delivering contextual insights, visual enhancements, and customized recommendations based on user preferences and location. The growing influence of digitally savvy travelers has encouraged tourism stakeholders to prioritize AR investments that improve satisfaction and destination appeal. This strong consumer-driven demand continues to shape product innovation and market growth strategies across the industry.
“Research Insight: Consumer demand for immersive, personalized travel experiences remains the strongest catalyst for AR tourism adoption.”
Travel and tourism companies, museums, cultural institutions, and hospitality providers are rapidly expanding their AR initiatives to remain competitive. These organizations recognize the potential of augmented reality to increase visitor engagement, strengthen brand differentiation, and generate additional revenue opportunities. Hospitality providers are introducing interactive property tours and local destination guides, while museums and cultural institutions use AR to modernize visitor experiences. Tourism companies leverage AR to enhance package offerings and destination marketing efforts. The collective adoption by institutional users is creating a broader foundation for long-term market expansion.
BY DEPLOYMENT MODE:
Cloud-based deployment dominates the augmented reality tourism market due to its scalability, flexibility, and ability to support real-time content updates across multiple locations. Tourism organizations increasingly prefer cloud environments because they reduce infrastructure costs while enabling seamless content management. Cloud-based platforms facilitate faster deployment of AR experiences and support large volumes of user interactions without significant hardware investments. Additionally, cloud solutions simplify integration with analytics tools, customer engagement platforms, and location-based services. These advantages position cloud deployment as the preferred operating model for organizations pursuing rapid digital transformation initiatives.
“Research Insight: Cloud deployment is becoming the standard foundation for scalable and continuously updated AR tourism experiences.”
On-premises deployment maintains relevance among organizations that prioritize data control, security, and customized operational environments. Certain cultural institutions, government-managed attractions, and large tourism enterprises continue investing in dedicated infrastructure to support specialized AR applications. While deployment costs can be higher, on-premises systems provide greater flexibility for organizations with unique technical requirements or regulatory obligations. As augmented reality solutions become increasingly sophisticated, a hybrid approach combining cloud efficiency with selective on-premises capabilities may emerge as a strategic option for organizations seeking optimal performance and operational control.
REGIONAL ANALYSIS:
North America leads the Augmented Reality Tourism Market through strong digital infrastructure, widespread smartphone adoption, and aggressive investment from tourism boards, museums, and entertainment venues. The United States and Canada continue to deploy immersive city tours, AR navigation, and interactive heritage experiences to attract domestic and international visitors. Europe follows closely, with countries such as France, Italy, Spain, and the United Kingdom integrating augmented reality into cultural tourism, museums, and historic landmarks to modernize visitor engagement while preserving storytelling. Asia Pacific shows the fastest growth, driven by rising tourism volumes, smart city development, and expanding mobile-first traveler behavior across China, Japan, South Korea, India, and Southeast Asia. Businesses across these regions use augmented reality to increase visitor engagement, extend dwell time, and create premium digital experiences that strengthen tourism revenue.
- “Regions investing in immersive tourism technology continue to increase visitor engagement, improve destination appeal, and unlock higher-value traveler spending across markets.”
Latin America continues to gain momentum as tourism operators adopt augmented reality to differentiate destinations, promote cultural heritage, and improve visitor accessibility through mobile experiences. Brazil, Mexico, and emerging tourism hubs increasingly use digital overlays for guided exploration and destination branding. Meanwhile, the Middle East & Africa market expands through large-scale tourism diversification projects, luxury hospitality development, and smart destination investments. Countries including the UAE and Saudi Arabia actively deploy immersive tourism technologies across heritage sites, entertainment attractions, and urban tourism zones to enhance visitor satisfaction. Across both regions, augmented reality creates strong commercial value by helping destinations modernize experiences, attract global travelers, and convert tourism demand into measurable revenue growth.
RECENT DEVELOPMENTS :
- In June 2026 – PortAventura World and Vekoma established WeRiseUp to commercialize mixed-reality experiences for museums, heritage sites, cultural attractions, and tourism operators, expanding immersive visitor engagement across global destinations.
- In May 2026 – Tourism technology providers showcased advanced AR, AI, and immersive visitor engagement solutions at international tourism events, accelerating adoption of interactive destination experiences and digital storytelling platforms.
- In June 2025 – Niantic Spatial entered a multi-year partnership with Snap to develop an AI-powered global map supporting location-based AR experiences, enabling tourism operators to create destination-specific immersive journeys.
- In June 2025 – Niantic Spatial and Meow Wolf announced collaboration to extend immersive storytelling beyond physical venues through AR-powered location experiences, creating new opportunities for tourism and cultural attractions.
- In June 2025 – Histoury introduced the Portyl application, allowing travelers to view historical reconstructions of archaeological sites using AR and AI-guided multilingual tours, enhancing cultural tourism experiences worldwide.
- In July 2025 – The Uttar Pradesh Tourism Department announced AR-enabled digital panels and interactive destination experiences for tourism promotion, reflecting broader governmental adoption of immersive tourism technologies.
COMPETITOR OUTLOOK:
The Strait of Augmented Reality Tourism Market is becoming increasingly competitive as technology providers, geospatial mapping companies, AR software developers, and tourism-experience specialists expand their offerings. Companies are focusing on location-based content, real-time navigation, digital heritage reconstruction, multilingual virtual guides, and AI-powered personalization. Strategic partnerships between AR platform providers and tourism organizations are enabling immersive destination experiences that enhance visitor engagement while generating new revenue opportunities for attractions, museums, and cultural sites.
Competition is also intensifying through investments in smart glasses, spatial computing, geospatial AI, and cloud-based AR content management systems. Market leaders are emphasizing scalable platforms capable of supporting tourism boards, heritage organizations, and travel operators. Firms with strong mapping capabilities, advanced computer vision technologies, and extensive developer ecosystems are expected to maintain competitive advantages as demand for immersive tourism experiences expands across global destinations.
KEY MARKET PLAYERS:
- Niantic Spatial
- Snap Inc.
- Apple
- Microsoft
- Meta Platforms
- PTC
- Unity Technologies
- Xreal
- RayNeo
- Scope AR
- Bravent
- WeRiseUp
- Histoury
- Meow Wolf
- Immotion
- Cosm
- Treeview Studio
- Mojo Vision
- Illumix
Augmented Reality Tourism Market-Table of Contents
Chapter 1: Introduction
- Market Definition
- Market Scope
- Research Objectives
- Research Assumptions
- Market Structure
- Stakeholder Analysis
- Report Inclusions and Exclusions
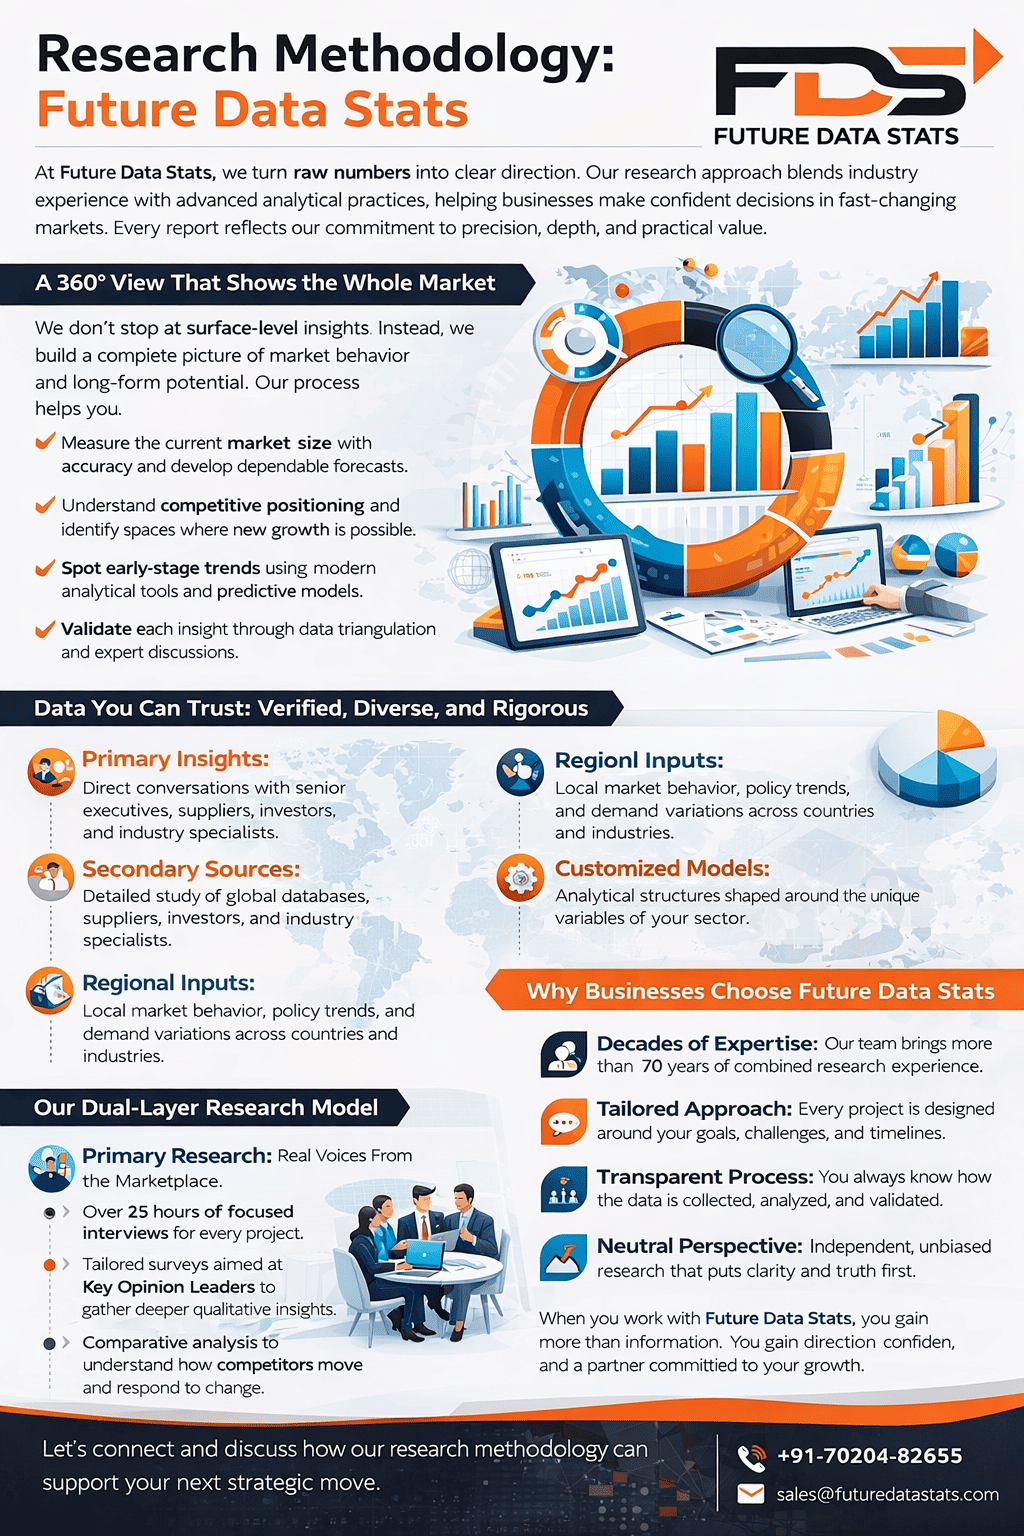
Chapter 2: Research Methodology
- Research Design
- Data Collection Methodology
- Primary Research
- Secondary Research
- Market Size Estimation
- Forecasting Methodology
- Data Validation
- Limitations of Study
Chapter 3: Executive Summary
- Market Overview
- Key Findings
- Market Snapshot
- Segmental Highlights
- Regional Highlights
- Competitive Landscape Snapshot
- Future Outlook
Chapter 4: Market Dynamics
- Introduction
- Market Drivers
- Rising Adoption of AR Technologies
- Growing Demand for Interactive Travel Experiences
- Increasing Smartphone Penetration
- Market Restraints
- High Implementation Costs
- Technical Limitations
- Market Opportunities
- Smart Tourism Initiatives
- Integration with AI and IoT
- Market Challenges
- Impact Analysis
Chapter 5: Industry Analysis
- Value Chain Analysis
- Supply Chain Analysis
- Porter’s Five Forces Analysis
- PESTLE Analysis
- Regulatory Landscape
- Technology Trends
- Investment Analysis
Chapter 6: Augmented Reality Tourism Market, By Component
- Overview
- Hardware
- Software
- Services
Chapter 7: Augmented Reality Tourism Market, By Device Type
- Overview
- Smartphones & Tablets
- AR Smart Glasses/Headsets
- Other Wearable Devices
Chapter 8: Augmented Reality Tourism Market, By Application
- Overview
- Destination Exploration
- Navigation & Wayfinding
- Cultural & Heritage Tourism
- Museum & Exhibition Experiences
- Theme Parks & Entertainment
Chapter 9: Augmented Reality Tourism Market, By End User
- Overview
- Individual Travelers
- Travel & Tourism Companies
- Museums & Cultural Institutions
- Hospitality Providers
Chapter 10: Augmented Reality Tourism Market, By Deployment Mode
- Overview
- On-Premises
- Cloud-Based
Chapter 11: Augmented Reality Tourism Market, By Region
- Overview
- North America
- United States
- Canada
- Mexico
- Europe
- Germany
- United Kingdom
- France
- Italy
- Spain
- Rest of Europe
- Asia-Pacific
- China
- Japan
- India
- South Korea
- Australia
- Rest of Asia-Pacific
- Latin America
- Brazil
- Argentina
- Rest of Latin America
- Middle East & Africa
- UAE
- Saudi Arabia
- South Africa
- Rest of Middle East & Africa
Chapter 12: Competitive Landscape
- Market Share Analysis
- Competitive Benchmarking
- Strategic Positioning Analysis
- Competitive Dashboard
- Key Developments
Chapter 13: Company Profiles
- Company Overview
- Business Description
- Product Portfolio
- Financial Overview
- Geographic Presence
- Recent Developments
- SWOT Analysis
Chapter 14: Strategic Recommendations
- Growth Opportunities
- Investment Areas
- Market Entry Strategies
- Expansion Strategies
- Technology Adoption Recommendations
Chapter 15: Conclusion and Analyst Insights
- Key Takeaways
- Future Market Outlook
- Analyst Perspective
- Conclusion
List of Tables
- Table 1: Augmented Reality Tourism Market Snapshot
- Table 2: Market Segmentation Overview
- Table 3: Global Augmented Reality Tourism Market Size, 2020–2035 (USD Million)
- Table 4: Market Growth Rate Analysis by Region
- Table 5: Key Market Drivers and Impact Assessment
- Table 6: Market Restraints and Impact Assessment
- Table 7: Market Opportunities Analysis
- Table 8: Market Value Chain Analysis
- Table 9: Porter’s Five Forces Analysis
- Table 10: Component Segment Revenue Analysis
- Table 11: Hardware Market Size by Region
- Table 12: Software Market Size by Region
- Table 13: Services Market Size by Region
- Table 14: Device Type Market Analysis
- Table 15: Smartphone & Tablet Segment Revenue Analysis
- Table 16: AR Smart Glasses/Headsets Segment Revenue Analysis
- Table 17: Wearable Devices Segment Revenue Analysis
- Table 18: Application Segment Market Analysis
- Table 19: Destination Exploration Market Size
- Table 20: Navigation & Wayfinding Market Size
- Table 21: Cultural & Heritage Tourism Market Size
- Table 22: Museum & Exhibition Experiences Market Size
- Table 23: Theme Parks & Entertainment Market Size
- Table 24: End User Market Analysis
- Table 25: Individual Travelers Segment Revenue Analysis
- Table 26: Travel & Tourism Companies Segment Revenue Analysis
- Table 27: Museums & Cultural Institutions Segment Revenue Analysis
- Table 28: Hospitality Providers Segment Revenue Analysis
- Table 29: Deployment Mode Market Analysis
- Table 30: On-Premises Segment Revenue Analysis
- Table 31: Cloud-Based Segment Revenue Analysis
- Table 32: North America Market Revenue Forecast
- Table 33: Europe Market Revenue Forecast
- Table 34: Asia-Pacific Market Revenue Forecast
- Table 35: Latin America Market Revenue Forecast
- Table 36: Middle East & Africa Market Revenue Forecast
- Table 37: Competitive Benchmarking of Leading Companies
- Table 38: Company Market Share Analysis
- Table 39: Strategic Developments Analysis
- Table 40: Mergers, Acquisitions, and Partnerships
List of Figures
- Figure 1: Global Augmented Reality Tourism Market Research Framework
- Figure 2: Market Size Estimation Methodology
- Figure 3: Market Forecasting Approach
- Figure 4: Global Augmented Reality Tourism Market Overview
- Figure 5: Market Dynamics Framework
- Figure 6: Market Driver Analysis
- Figure 7: Market Restraint Analysis
- Figure 8: Market Opportunity Analysis
- Figure 9: Value Chain Analysis
- Figure 10: Porter’s Five Forces Analysis
- Figure 11: Global Market Revenue Trend, 2020–2035
- Figure 12: Market Share by Component
- Figure 13: Market Share by Device Type
- Figure 14: Market Share by Application
- Figure 15: Market Share by End User
- Figure 16: Market Share by Deployment Mode
- Figure 17: Hardware Revenue Trend
- Figure 18: Software Revenue Trend
- Figure 19: Services Revenue Trend
- Figure 20: Smartphone & Tablet Segment Analysis
- Figure 21: AR Smart Glasses/Headsets Segment Analysis
- Figure 22: Wearable Devices Segment Analysis
- Figure 23: Destination Exploration Segment Analysis
- Figure 24: Navigation & Wayfinding Segment Analysis
- Figure 25: Cultural & Heritage Tourism Segment Analysis
- Figure 26: Museum & Exhibition Experiences Segment Analysis
- Figure 27: Theme Parks & Entertainment Segment Analysis
- Figure 28: Individual Travelers Market Analysis
- Figure 29: Travel & Tourism Companies Market Analysis
- Figure 30: Museums & Cultural Institutions Market Analysis
- Figure 31: Hospitality Providers Market Analysis
- Figure 32: On-Premises Market Analysis
- Figure 33: Cloud-Based Market Analysis
- Figure 34: North America Market Analysis
- Figure 35: Europe Market Analysis
- Figure 36: Asia-Pacific Market Analysis
- Figure 37: Latin America Market Analysis
- Figure 38: Middle East & Africa Market Analysis
- Figure 39: Competitive Landscape Overview
- Figure 40: Market Share Analysis of Key Players
Augmented Reality Tourism Market Segmentation
By Component:
- Hardware
- Software
- Services
By Device Type:
- Smartphones & Tablets
- AR Smart Glasses/Headsets
- Other Wearable Devices
By Application:
- Destination Exploration
- Navigation & Wayfinding
- Cultural & Heritage Tourism
- Museum & Exhibition Experiences
- Theme Parks & Entertainment
By End User:
- Individual Travelers
- Travel & Tourism Companies
- Museums & Cultural Institutions
- Hospitality Providers
By Deployment Mode:
- On-Premises
- Cloud-Based
By Geography:
- North America (USA, Canada, Mexico)
- Europe (UK, Germany, France, Italy, Spain, Rest of Europe)
- Asia-Pacific (China, Japan, Australia, South Korea, India, Rest of Asia-Pacific)
- South America (Brazil, Argentina, Rest of South America)
- Middle East and Africa (GCC Countries, South Africa, Rest of MEA)
Augmented Reality Tourism Market Dynamic Factors
Drivers:
- Enhance visitor engagement through immersive destination experiences.
- Increase smartphone adoption that supports AR applications.
- Strengthen tourism promotion with interactive digital storytelling.
Restraints:
- Require high initial investment for AR content development.
- Face device compatibility limitations across user segments.
- Encounter privacy concerns related to location-based services.
Opportunities:
- Expand AR-guided heritage and cultural tourism programs.
- Integrate AI to deliver personalized travel experiences.
- Develop smart tourism initiatives across emerging destinations.
Challenges:
- Maintain accurate real-time location and mapping data.
- Create high-quality content for diverse tourist attractions.
- Ensure seamless performance in areas with weak connectivity.
Augmented Reality Tourism Market Regional Key Trends
North America:
- Adopt AR navigation across major tourist destinations.
- Increase investment in immersive tourism technologies.
- Expand partnerships between tourism boards and AR providers.
Europe:
- Digitize heritage sites with AR-based historical reconstruction.
- Promote museum experiences through interactive visitor tools.
- Support smart tourism projects with public funding initiatives.
Asia Pacific:
- Accelerate AR adoption in cultural and urban tourism.
- Launch mobile-based AR experiences for international visitors.
- Expand smart city programs that integrate tourism technologies.
Latin America:
- Enhance destination marketing with AR-enabled campaigns.
- Develop interactive experiences at historical attractions.
- Increase tourism technology investments in key travel markets.
Middle East & Africa:
- Introduce AR experiences within large-scale tourism projects.
- Modernize visitor engagement at cultural landmarks.
- Strengthen digital tourism strategies through government support.
Frequently Asked Questions