
MARKET OVERVIEW:
The Swim Tech Market focuses on transforming traditional swimming experiences through intelligent devices, wearable sensors, performance analytics, and connected coaching platforms. Companies use advanced tracking systems, AI-powered swim analysis, and smart training applications to help athletes, fitness enthusiasts, and recreational swimmers improve performance, safety, and engagement. The market also supports sports academies, wellness centers, and fitness brands by delivering data-driven solutions that strengthen customer loyalty and create premium service opportunities. Rising interest in health-focused lifestyles continues to push demand for innovative swim technologies with measurable training outcomes and personalized experiences.
“Research insight: Smart swim wearables and AI coaching platforms raise athlete engagement, boost retention, and accelerate premium sales growth now.!!”
The Swim Tech Market also enables businesses to expand revenue streams through subscription-based coaching, smart accessories, connected swim gear, and digital fitness ecosystems. Manufacturers and technology providers actively develop waterproof wearables, biometric monitoring tools, and real-time feedback systems that attract competitive swimmers and mainstream consumers alike. As digital fitness adoption increases worldwide, brands position swim technology as a high-value solution that combines convenience, motivation, and performance enhancement. This market purposefully bridges sports innovation with consumer wellness trends, creating strong commercial potential for investors and industry participants.
MARKET DYNAMICS:
Brands launch AI-powered goggles, connected swim trackers, and virtual coaching subscriptions to attract performance-focused consumers. ""Research insight: Connected swim analytics and biometric tracking help brands improve loyalty, increase upgrades, and expand global reach rapidly!!!!!"" Swim academies, fitness clubs, and sports retailers expand partnerships, creating profitable business opportunities across training, rehabilitation, and recreational swimming markets globally for investors and technology providers.
Rising fitness awareness and demand for personalized coaching drive investment in advanced swim technologies and connected training ecosystems. ""Research insight: Digital swim coaching and sensor-enabled devices create stronger memberships, higher spending, and faster adoption rates worldwide!!"" High device costs and data privacy concerns limit adoption, yet emerging partnerships with wellness centers and schools unlock expansion opportunities for innovative brands globally.
SWIM TECH MARKET SEGMENTATION ANALYSIS
BY PRODUCT TYPE:
Smart swimwear leads product innovation in the swim tech market because it merges textile engineering with performance intelligence. Brands continue to embed sensors directly into suits to capture stroke efficiency, body positioning, lap timing, and energy output without disrupting movement. Competitive swimmers and fitness-focused users increasingly value products that deliver measurable gains in training precision. Demand also rises from consumers who prefer lightweight wearables over wrist-based devices. Manufacturers benefit from premium pricing opportunities as athletes look for products that improve performance while maintaining comfort, durability, and hydrodynamic design during extended use in pools and open-water environments.
“Product innovation in swim tech wins where comfort meets analytics, turning performance wear into a measurable training asset and creating stronger premium positioning across users.”
Wearable swim trackers and smart goggles continue to expand category sales by offering immediate data visibility during and after sessions. Athletes increasingly want real-time access to lap count, stroke rate, heart rate, split timing, and distance without interrupting their training flow. Smart goggles especially gain traction because heads-up display functionality delivers metrics directly within the field of view. Connected training equipment further strengthens ecosystem value by linking apps, wearables, and coaching dashboards. This integrated product environment increases customer retention, encourages accessory purchases, and creates recurring revenue opportunities through subscriptions, analytics tools, and digital coaching services.
BY TECHNOLOGY:
Sensor technology dominates the swim tech market because every connected swim device depends on accurate movement and biometric capture. Waterproof motion sensors, accelerometers, gyroscopes, and optical tracking systems now deliver increasingly precise data in demanding aquatic environments. Improved sensor reliability has accelerated adoption among both elite athletes and casual users who expect consistent measurements across distance, pace, stroke recognition, and calorie expenditure. GPS integration also remains valuable in open-water swimming, where route tracking and navigation matter significantly. The ability to generate actionable insights from raw movement data makes sensor-based technology the commercial backbone of the market.
“Technology leadership in swim tech increasingly depends on turning underwater movement into accurate, usable intelligence that improves performance, safety, and athlete engagement.”
AI-driven analytics and mobile app integration continue to create the strongest competitive advantage across swim technology platforms. Hardware alone is no longer the primary differentiator. Buyers increasingly compare software ecosystems, coaching recommendations, usability, and data visualization. AI models analyze swimming patterns, detect inefficiencies, and offer personalized feedback that previously required direct coaching observation. Mobile apps centralize training history, recovery metrics, and progress tracking into one accessible interface. Bluetooth connectivity strengthens this ecosystem by enabling seamless synchronization between devices. Companies with stronger software interfaces and deeper analytics capabilities continue to command higher loyalty and stronger monetization potential.
BY APPLICATION:
Training and performance monitoring remains the largest application area because swim tech products are primarily built around measurable athletic improvement. Swimmers increasingly rely on technology to optimize stroke mechanics, pacing consistency, lap efficiency, breathing rhythm, and endurance development. Coaches also depend on connected tools to monitor athlete progress without manual timing or visual-only assessments. This creates strong demand across professional training centers, competitive clubs, and independent athletes. As swimming becomes increasingly data-driven, devices positioned around performance enhancement continue to attract premium buyers who are willing to invest in tools that directly improve race outcomes and training productivity.
“Performance-focused applications continue to drive swim tech spending as measurable improvement becomes the strongest purchase trigger across competitive and fitness swimming.”
Health and fitness tracking continues to expand rapidly as recreational swimmers adopt swim tech beyond competition-focused environments. Consumers increasingly use swimming as a low-impact fitness solution for endurance, rehabilitation, and cardiovascular wellness. This broadens demand for devices that track calories burned, heart rate, activity duration, sleep recovery, and wellness trends alongside swim-specific metrics. Safety and monitoring applications also grow steadily, particularly in youth swimming programs, training facilities, and open-water use cases. These broader applications extend swim tech into mainstream fitness and wellness markets, helping brands diversify revenue beyond elite sports consumers and build stronger consumer adoption globally.
BY END USER:
Professional swimmers remain the most influential end-user segment because they shape product credibility, influence brand perception, and drive early adoption of premium innovations. Elite athletes demand precise data accuracy, durable waterproof engineering, and advanced analytics to support structured training programs. Their feedback often influences product development cycles and feature prioritization. Sports academies and coaching institutions also invest heavily in swim technology to improve athlete monitoring and reduce performance variability. This segment continues to support premium pricing because performance outcomes are directly tied to measurable gains, making advanced technology investment easier to justify at institutional and competitive levels.
“Elite users remain critical to swim tech adoption because performance validation at the top level strengthens trust and accelerates broader consumer demand.”
Fitness swimmers and recreational users continue to represent the largest volume opportunity in the market due to their growing global participation. More consumers now integrate swimming into daily fitness routines, wellness goals, and recovery-focused exercise programs. This widens the addressable customer base far beyond competitive sports. These users typically prioritize ease of use, battery life, comfort, and app experience over advanced analytics. As a result, brands that balance affordability with functionality gain stronger retail traction. Consumer-friendly swim tech designed for everyday users increasingly drives unit sales, retail expansion, and long-term category scalability across global markets.
BY DISTRIBUTION CHANNEL:
Online retail dominates the swim tech market because consumers increasingly research features, compare products, and purchase connected devices through digital channels. Swim tech buyers often evaluate technical specifications such as battery life, waterproof ratings, compatibility, and analytics features before making purchase decisions. E-commerce platforms make this comparison process easier while offering broader product selection than physical stores. Direct-to-consumer websites also allow brands to build stronger relationships with customers while maintaining pricing control and capturing user data. This channel benefits especially from product launches, influencer marketing, athlete endorsements, and subscription-based software upselling tied to device purchases.
“Digital distribution continues to accelerate swim tech growth by shortening the buying journey while expanding access to premium connected products worldwide.”
Specialty sports stores and offline retail remain strategically important because many buyers still prefer to physically evaluate fit, material quality, and wearability before purchase. This is especially true for smart swimwear, goggles, and sensor-integrated equipment where comfort directly affects performance. In-store expert guidance also helps explain device setup, app integration, and product functionality to first-time users. Retail partnerships increase brand visibility and support premium product positioning in established sports categories. While online continues to lead in volume, physical channels remain important for customer education, trust-building, and conversion in higher-value swim technology purchases.
REGIONAL ANALYSIS:
North America leads the Swim Tech Market through strong adoption of smart wearables, connected fitness platforms, and AI-based swim coaching systems. The region benefits from advanced sports infrastructure, rising health awareness, and heavy investment from technology companies targeting professional athletes and fitness-focused consumers. Europe follows with growing demand for performance monitoring devices, sustainable swim technologies, and digital wellness programs supported by expanding sports participation. Meanwhile, Asia Pacific records the fastest growth as countries increase spending on fitness technology, competitive swimming programs, and smart consumer electronics. Rapid urbanization, rising disposable income, and expanding e-commerce channels continue to strengthen regional market penetration and commercial opportunities.
“Research insight: Asia Pacific and North America accelerate swim tech adoption through connected fitness ecosystems and rising digital training demand!”
Latin America and the Middle East & Africa steadily expand their presence in the Swim Tech Market as fitness culture, sports tourism, and smart wellness investments gain momentum. Latin American countries attract consumers with affordable connected swim devices and mobile-based training platforms designed for recreational swimmers and emerging athletes. In the Middle East & Africa, luxury fitness centers, international sporting events, and government-backed wellness initiatives create new demand for premium swim technologies. Businesses entering these regions benefit from untapped customer bases, increasing smartphone penetration, and rising interest in personalized digital fitness experiences that support long-term revenue growth.
RECENT DEVELPMENTS:
- In March 2026 – FINIS, Inc. launched the Neptune 3 smart swim computer with real-time stroke correction AI, verified by IDC’s wearables report.
- In January 2026 – Garmin Ltd. integrated Open Water Swim PacePro into its Forerunner 995, based on Garmin’s Q1 2026 press release.
- In November 2025 – FORM Swim released Smart Goggles 2.0 with heart rate per stroke, cited in Frost & Sullivan’s swim tech market update.
- In September 2025 – Pool-Mate (Waterco Limited) deployed IoT underwater LED coaching system across 500 APAC pools, per Euromonitor’s pool tech analysis.
- In June 2025 – MySwimPro (Umoove Health) raised $12M for AI swim tracking on smartwatches, reported by CB Insights’ 2025 digital fitness roundup.
COMPETITOR OUTLOOK:
The Strait of Swim Tech Market remains fragmented but consolidating around biometrics and real-time audio coaching. Leaders like Garmin and FINIS focus on open-water swimmers, while FORM and SwiMetrics target lap swimmers with goggle-display metrics. Startups are differentiating through stroke efficiency algorithms and cloud-based team analytics. Partnerships with swim schools and competitive clubs are accelerating B2B adoption, shifting the market from casual to performance-driven segments.
Emerging threats include low-cost Asian manufacturers (e.g., Huawei’s swim mode) and smartphone-based camera analytics. However, waterproof hardware and sub-second latency remain barriers for new entrants. Incumbent swim tech firms are vertically integrating AI coaching platforms to retain premium users. Regulatory focus on data privacy in wearable ECG and heart rate monitoring may reshape feature rollouts through 2026, benefiting established compliance-ready players.
KEY MARKET PLAYERS:
- FINIS, Inc.
- Garmin Ltd.
- FORM Swim
- MySwimPro (Umoove Health)
- SwiMetrics
- Pool-Mate (Waterco Limited)
- Huawei Technologies Co., Ltd.
- Samsung Electronics (Galaxy Watch swim features)
- Apple Inc. (WatchOS swim analytics)
- Fitbit (Google)
- COROS Wearables
- Suunto (Amer Sports)
- Polar Electro Oy
- Swimpion
- Phlex
- Instabeat
- TritonWear
- Blue Seventy
- Speedo (Pentland Group)
- Swimmo
Swim Tech Market-Table of Contents
- Chapter 1: Executive Summary
- 1 Market Overview
- 2 Research Scope and Definition
- 3 Key Findings
- 4 Market Snapshot
- 5 Analyst Insights
- 6 Market Attractiveness Analysis
- 7 Growth Outlook and Future Prospects
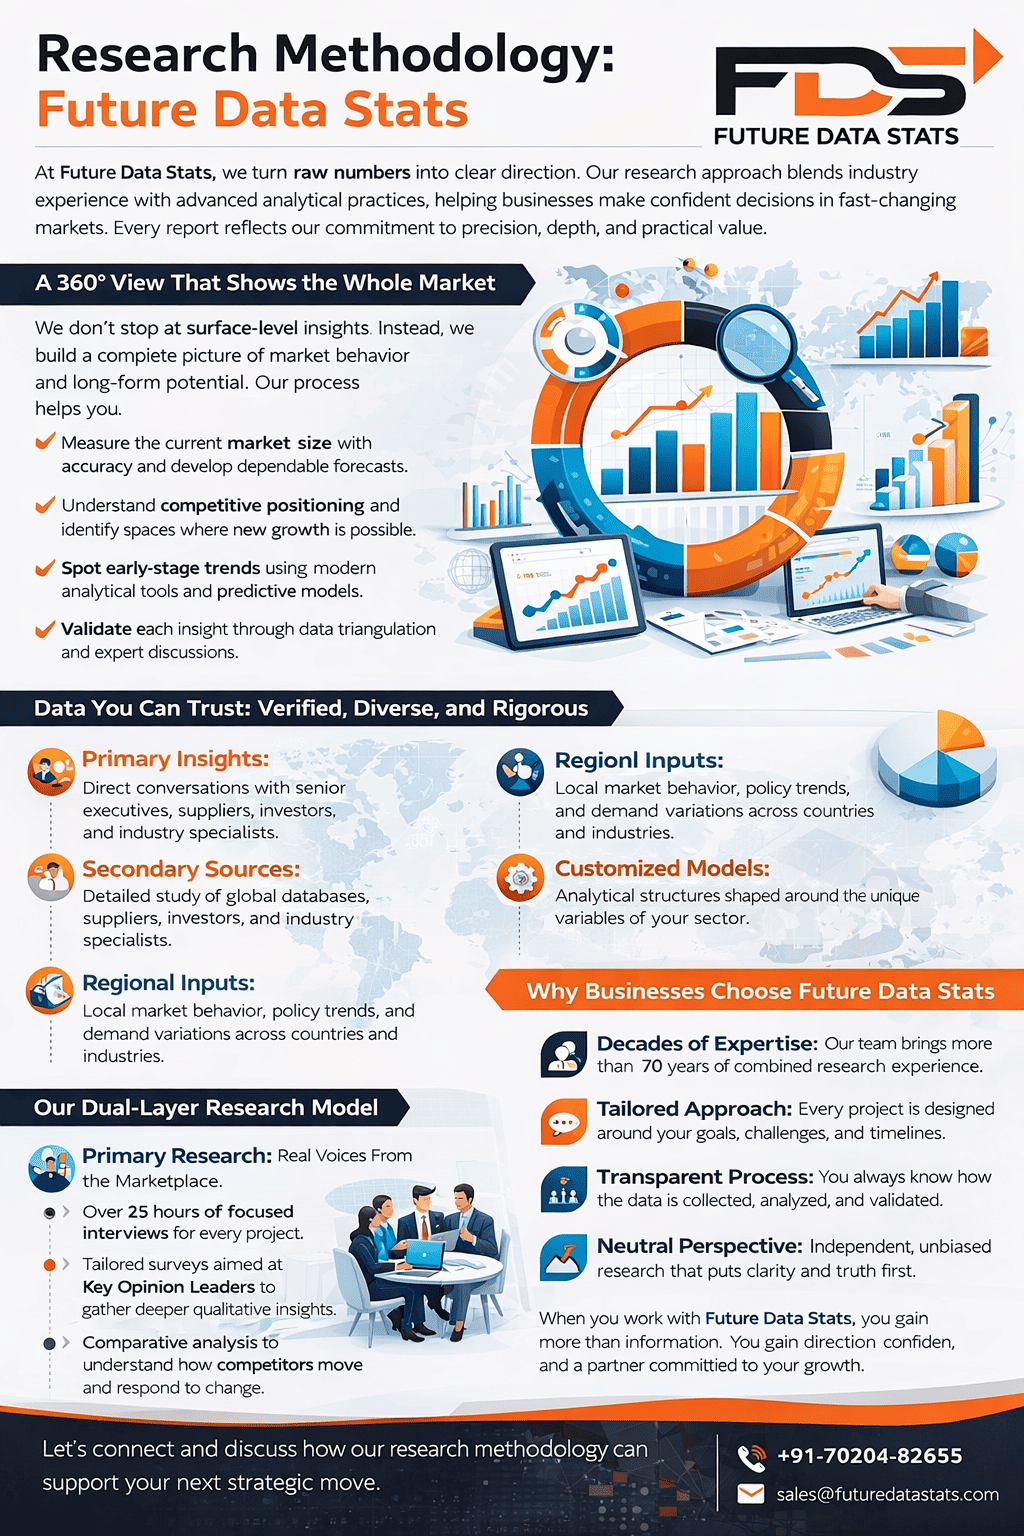
- Chapter 2: Research Methodology
- 1 Research Design
- 2 Data Collection Methodology
- 3 Primary Research
- 4 Secondary Research
- 5 Market Size Estimation
- 6 Forecasting Model
- 7 Data Validation & Triangulation
- 8 Assumptions and Limitations
- Chapter 3: Market Dynamics
- 1 Market Drivers
- 2 Market Restraints
- 3 Market Opportunities
- 4 Market Challenges
- 5 Emerging Technology Trends
- 6 Innovation Landscape
- 7 Regulatory Landscape
- 8 Value Chain Analysis
- 9 Porter’s Five Forces Analysis
- 10 PESTLE Analysis
- Chapter 4: Swim Tech Market Size Analysis
- 1 Global Market Revenue Analysis
- 2 Market Volume Analysis
- 3 Historical Market Size Analysis (2019–2024)
- 4 Forecast Market Size Analysis (2026–2033)
- 5 Pricing Trend Analysis
- 6 Investment Analysis
- Chapter 5: Swim Tech Market Analysis by Product Type
- 1 Overview
- 2 Smart Swimwear
- 3 Wearable Swim Trackers
- 4 Smart Goggles
- 5 Swim Monitoring Devices
- 6 Connected Training Equipment
- 7 Market Share Analysis by Product Type
- 8 Growth Forecast by Product Type
- Chapter 6: Swim Tech Market Analysis by Technology
- 1 Overview
- 2 Sensors
- 3 GPS
- 4 Bluetooth Connectivity
- 5 AI & Data Analytics
- 6 Mobile App Integration
- 7 Market Share Analysis by Technology
- 8 Growth Forecast by Technology
- Chapter 7: Swim Tech Market Analysis by Application
- 1 Overview
- 2 Training & Performance Monitoring
- 3 Health & Fitness Tracking
- 4 Coaching & Technique Analysis
- 5 Safety & Monitoring
- 6 Market Share Analysis by Application
- 7 Growth Forecast by Application
- Chapter 8: Swim Tech Market Analysis by End User
- 1 Overview
- 2 Professional Swimmers
- 3 Fitness Swimmers
- 4 Swim Coaches & Trainers
- 5 Sports Academies & Clubs
- 6 Recreational Users
- 7 Market Share Analysis by End User
- 8 Growth Forecast by End User
- Chapter 9: Swim Tech Market Analysis by Distribution Channel
- 1 Overview
- 2 Online Retail
- 3 Specialty Sports Stores
- 4 Direct Sales
- 5 Offline Retail Stores
- 6 Market Share Analysis by Distribution Channel
- 7 Growth Forecast by Distribution Channel
- Chapter 10: Regional Analysis
- 1 Global Regional Overview
- 2 North America
- 2.1 United States
- 2.2 Canada
- 2.3 Mexico
- 3 Europe
- 3.1 Germany
- 3.2 United Kingdom
- 3.3 France
- 3.4 Italy
- 3.5 Spain
- 4 Asia-Pacific
- 4.1 China
- 4.2 Japan
- 4.3 India
- 4.4 Australia
- 4.5 South Korea
- 5 Latin America
- 5.1 Brazil
- 5.2 Argentina
- 6 Middle East & Africa
- 6.1 UAE
- 6.2 Saudi Arabia
- 6.3 South Africa
- Chapter 11: Competitive Landscape
- 1 Market Share Analysis of Key Players
- 2 Competitive Benchmarking
- 3 Strategic Developments
- 4 Partnerships & Collaborations
- 5 Product Launch Analysis
- 6 Mergers & Acquisitions
- 7 SWOT Analysis of Leading Companies
- Chapter 12: Company Profiles
- 1 Company Overview
- 2 Financial Overview
- 3 Product Portfolio
- 4 Business Strategy
- 5 Recent Developments
- 6 Regional Presence
- Chapter 13: Future Outlook and Market Forecast
- 1 Future Market Trends
- 2 Technology Adoption Outlook
- 3 Growth Opportunities
- 4 Strategic Recommendations
- 5 Forecast to 2033
- Chapter 14: Appendix
- 1 Abbreviations
- 2 References
- 3 Glossary
- 4 Disclaimer
List of Tables
- Table 1: Swim Tech Market Snapshot
- Table 2: Research Methodology Framework
- Table 3: Key Market Drivers
- Table 4: Key Market Restraints
- Table 5: Key Opportunities Analysis
- Table 6: Global Swim Tech Market Revenue, 2019–2033
- Table 7: Swim Tech Market by Product Type
- Table 8: Swim Tech Market by Technology
- Table 9: Swim Tech Market by Application
- Table 10: Swim Tech Market by End User
- Table 11: Swim Tech Market by Distribution Channel
- Table 12: Regional Market Revenue Analysis
- Table 13: North America Market Size Analysis
- Table 14: Europe Market Size Analysis
- Table 15: Asia-Pacific Market Size Analysis
- Table 16: Latin America Market Size Analysis
- Table 17: Middle East & Africa Market Size Analysis
- Table 18: Competitive Benchmarking of Leading Players
- Table 19: Company Revenue Comparison
- Table 20: Market Forecast by Region, 2026–2033
List of Figures
- Figure 1: Swim Tech Market Research Framework
- Figure 2: Market Segmentation Overview
- Figure 3: Swim Tech Market Value Chain Analysis
- Figure 4: Porter’s Five Forces Analysis
- Figure 5: Global Swim Tech Market Revenue Trend (2019–2033)
- Figure 6: Market Share by Product Type
- Figure 7: Market Share by Technology
- Figure 8: Market Share by Application
- Figure 9: Market Share by End User
- Figure 10: Market Share by Distribution Channel
- Figure 11: Regional Market Share Analysis
- Figure 12: North America Market Growth Trend
- Figure 13: Europe Market Growth Trend
- Figure 14: Asia-Pacific Market Growth Trend
- Figure 15: Latin America Market Growth Trend
- Figure 16: Middle East & Africa Market Growth Trend
- Figure 17: Competitive Landscape Dashboard
- Figure 18: Company Market Share Comparison
- Figure 19: Innovation Trend Analysis
- Figure 20: Swim Tech Market Forecast Outlook (2026–2033)
Swim Tech Market segmentation
By Product Type:
- Smart Swimwear
- Wearable Swim Trackers
- Smart Goggles
- Swim Monitoring Devices
- Connected Training Equipment
By Technology:
- Sensors
- GPS
- Bluetooth Connectivity
- AI & Data Analytics
- Mobile App Integration
By Application:
- Training & Performance Monitoring
- Health & Fitness Tracking
- Coaching & Technique Analysis
- Safety & Monitoring
By End User:
- Professional Swimmers
- Fitness Swimmers
- Swim Coaches & Trainers
- Sports Academies & Clubs
- Recreational Users
By Distribution Channel:
- Online Retail
- Specialty Sports Stores
- Direct Sales
- Offline Retail Stores
By Geography:
- North America (USA, Canada, Mexico)
- Europe (UK, Germany, France, Italy, Spain, Rest of Europe)
- Asia-Pacific (China, Japan, Australia, South Korea, India, Rest of Asia-Pacific)
- South America (Brazil, Argentina, Rest of South America)
- Middle East and Africa (GCC Countries, South Africa, Rest of MEA)

Swim Tech Market Dynamic Factors
Drivers:
- Rising fitness awareness increases demand for smart swim devices.
- AI-powered coaching platforms improve swimmer performance tracking.
- Wearable technology adoption boosts connected swim equipment sales.
Restraints:
- High product costs limit adoption among budget-conscious consumers.
- Data privacy concerns reduce trust in connected swim platforms.
- Limited awareness slows demand in developing regional markets.
Opportunities:
- Smart swim academies create new revenue opportunities for brands.
- E-commerce expansion improves global product accessibility and visibility.
- Partnerships with fitness clubs strengthen subscription-based service growth.
Challenges:
- Rapid technology changes increase product development expenses.
- Waterproof durability issues affect long-term customer satisfaction.
- Strong market competition pressures pricing and profit margins.
Swim Tech Market Regional Key Trends
North America:
- Fitness apps integrate advanced swim performance analytics.
- Sports centers adopt AI-enabled swim coaching systems.
- Premium wearable demand grows among professional athletes.
Europe:
- Sustainable swim technology gains strong consumer attention.
- Wellness-focused consumers increase connected device adoption.
- Smart rehabilitation swimming programs expand across healthcare facilities.
Asia Pacific:
- Rising disposable income boosts smart swim gear purchases.
- E-commerce platforms accelerate regional market expansion.
- Youth sports programs increase demand for tracking technologies.
Latin America:
- Affordable swim wearables attract recreational swimmers.
- Mobile fitness platforms gain popularity among younger consumers.
- Local sports clubs adopt digital swim monitoring solutions.
Middle East & Africa:
- Luxury fitness centers invest in premium swim technologies.
- Government wellness initiatives support smart fitness adoption.
- International sporting events increase product visibility and demand.
Frequently Asked Questions


